Client KPI Dashboards
Freelance client work · React dashboards
Interactive KPI dashboards for a freelance client, bringing several data sources together behind one Node.js API.
Data
API
UI
Problem
Decisions ran on static exports and spreadsheets, so trends surfaced late.
Solution
React dashboards with filterable KPIs and trend views, on a Node.js API over several data sources.
Result
Filterable KPIs in one place instead of hand-refreshed reports.
Overview
A freelance client was working from static exports and one-off spreadsheets, so trends stayed hidden until someone refreshed a report by hand. The goal was interactive dashboards that make KPIs easier to read.
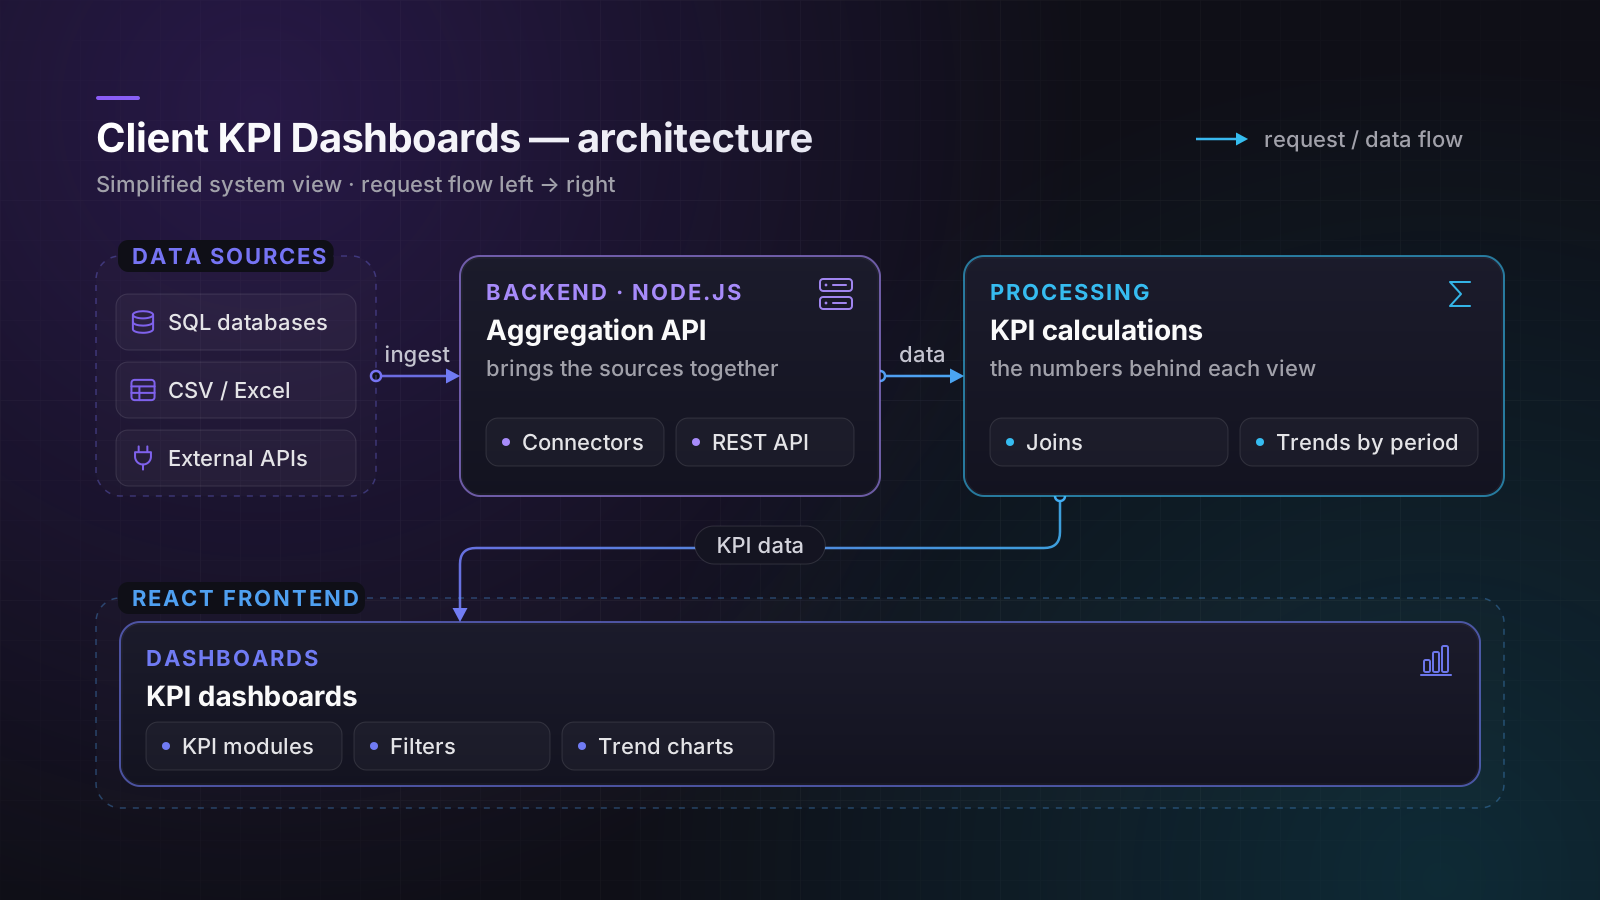
I built a React front end with filterable KPI modules and trend views, and a Node.js API that brings several data sources together behind one REST interface. The code belongs to the client, so the diagram shows the architecture.
What it does
- Filterable KPI modules instead of static exports
- A Node.js API that brings several data sources together
- Trend views that make changes easy to spot
What's next
Hiring for a full-stack, Python or AI role — or need something like this built? Let's talk.
I'm available immediately — on-site or hybrid in Moscow, or remote; full-time or contract. I reply within 48 hours — faster on Telegram.